3.2 Genome page
In this part, PlanT2T provides meta information for each species. Information includes assembly level, total length (bp), number of genes, busco of eukaryote, and publication, etc.
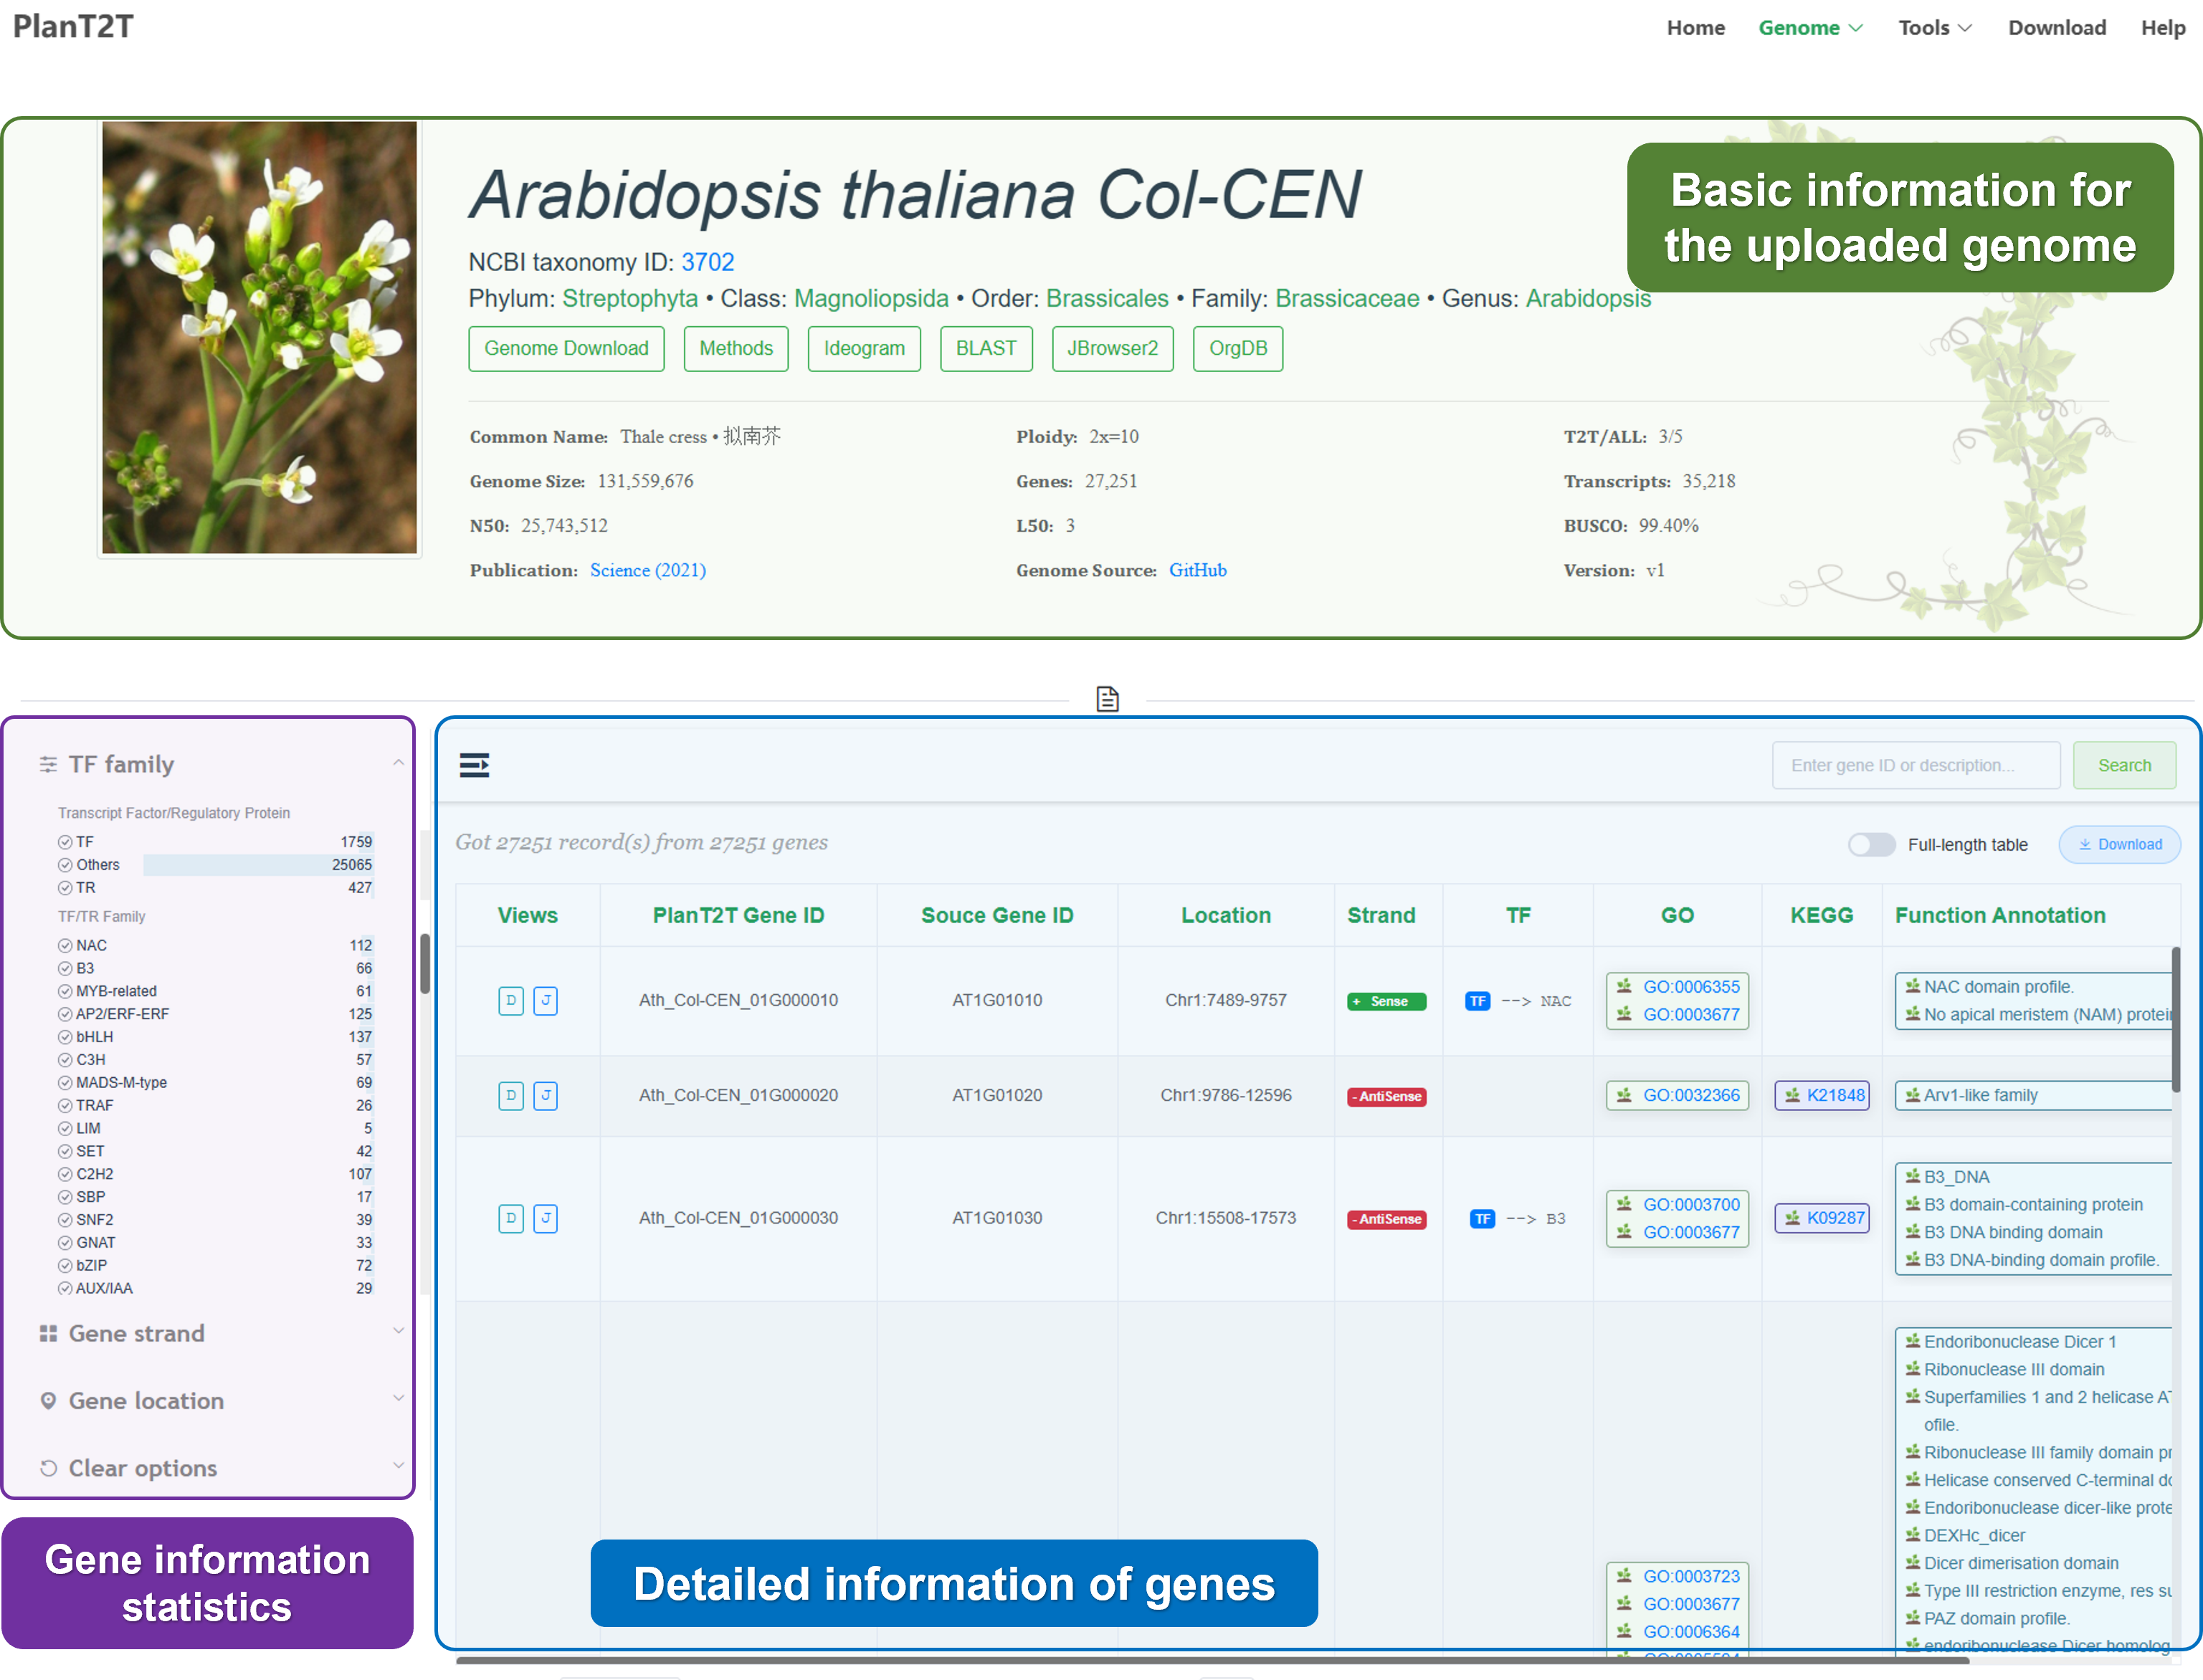
3.2.1 Genome information
Here, you can view the genome information of the species you are interested in.
3.2.2 Detailed information
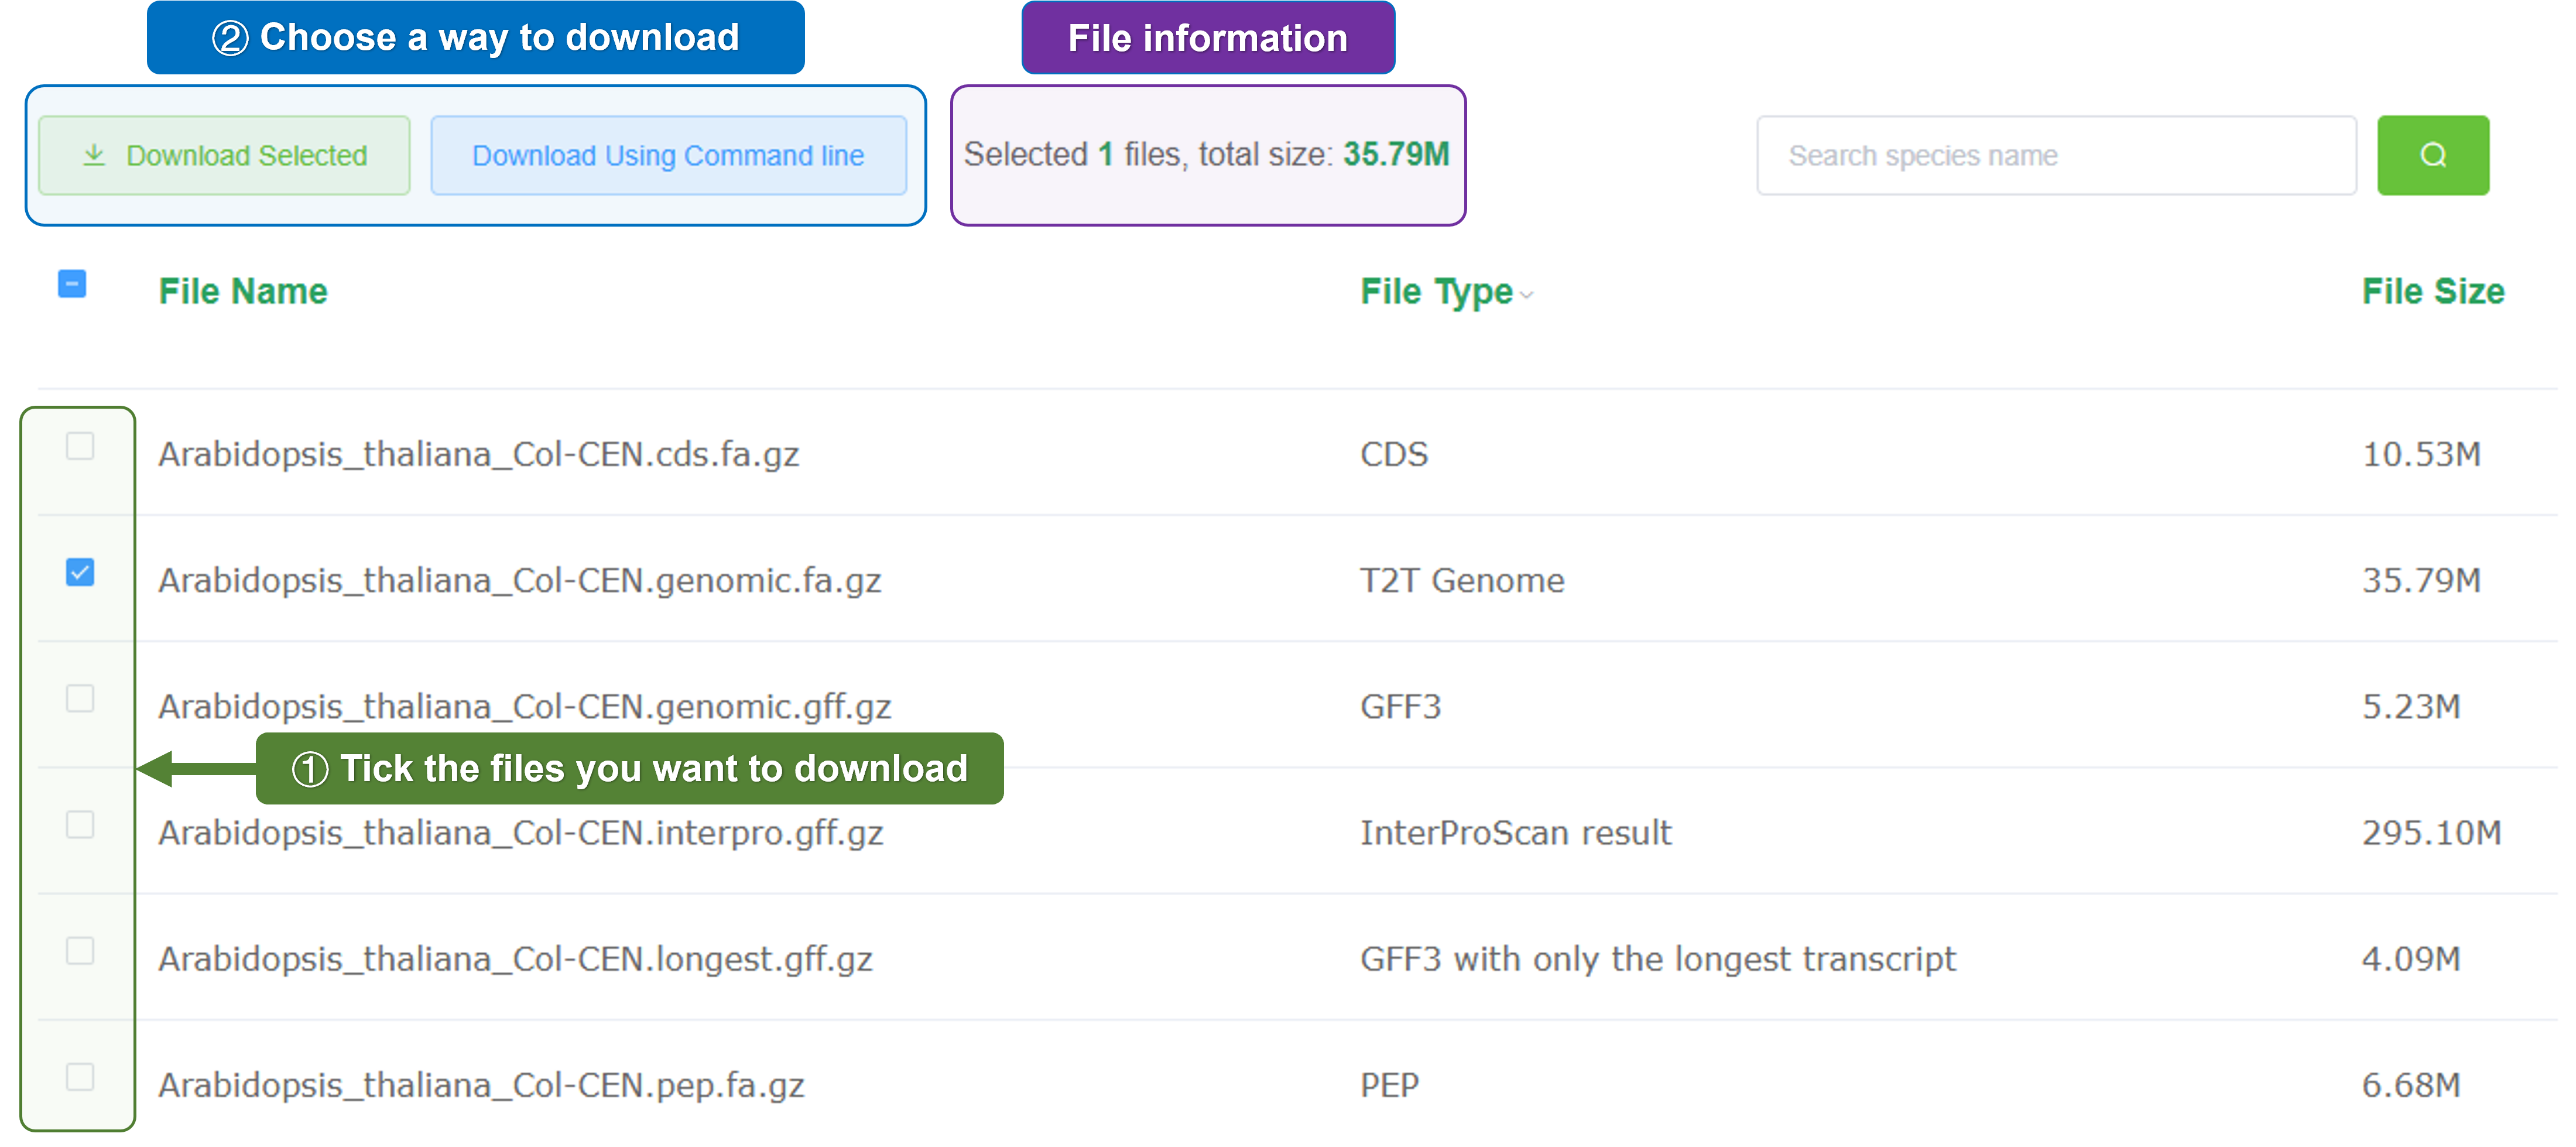
- Download: Quickly download the genomic data for offline analysis or further study.
- Methods: View the methods used to generate the genomic data. The information was collected from the publication.
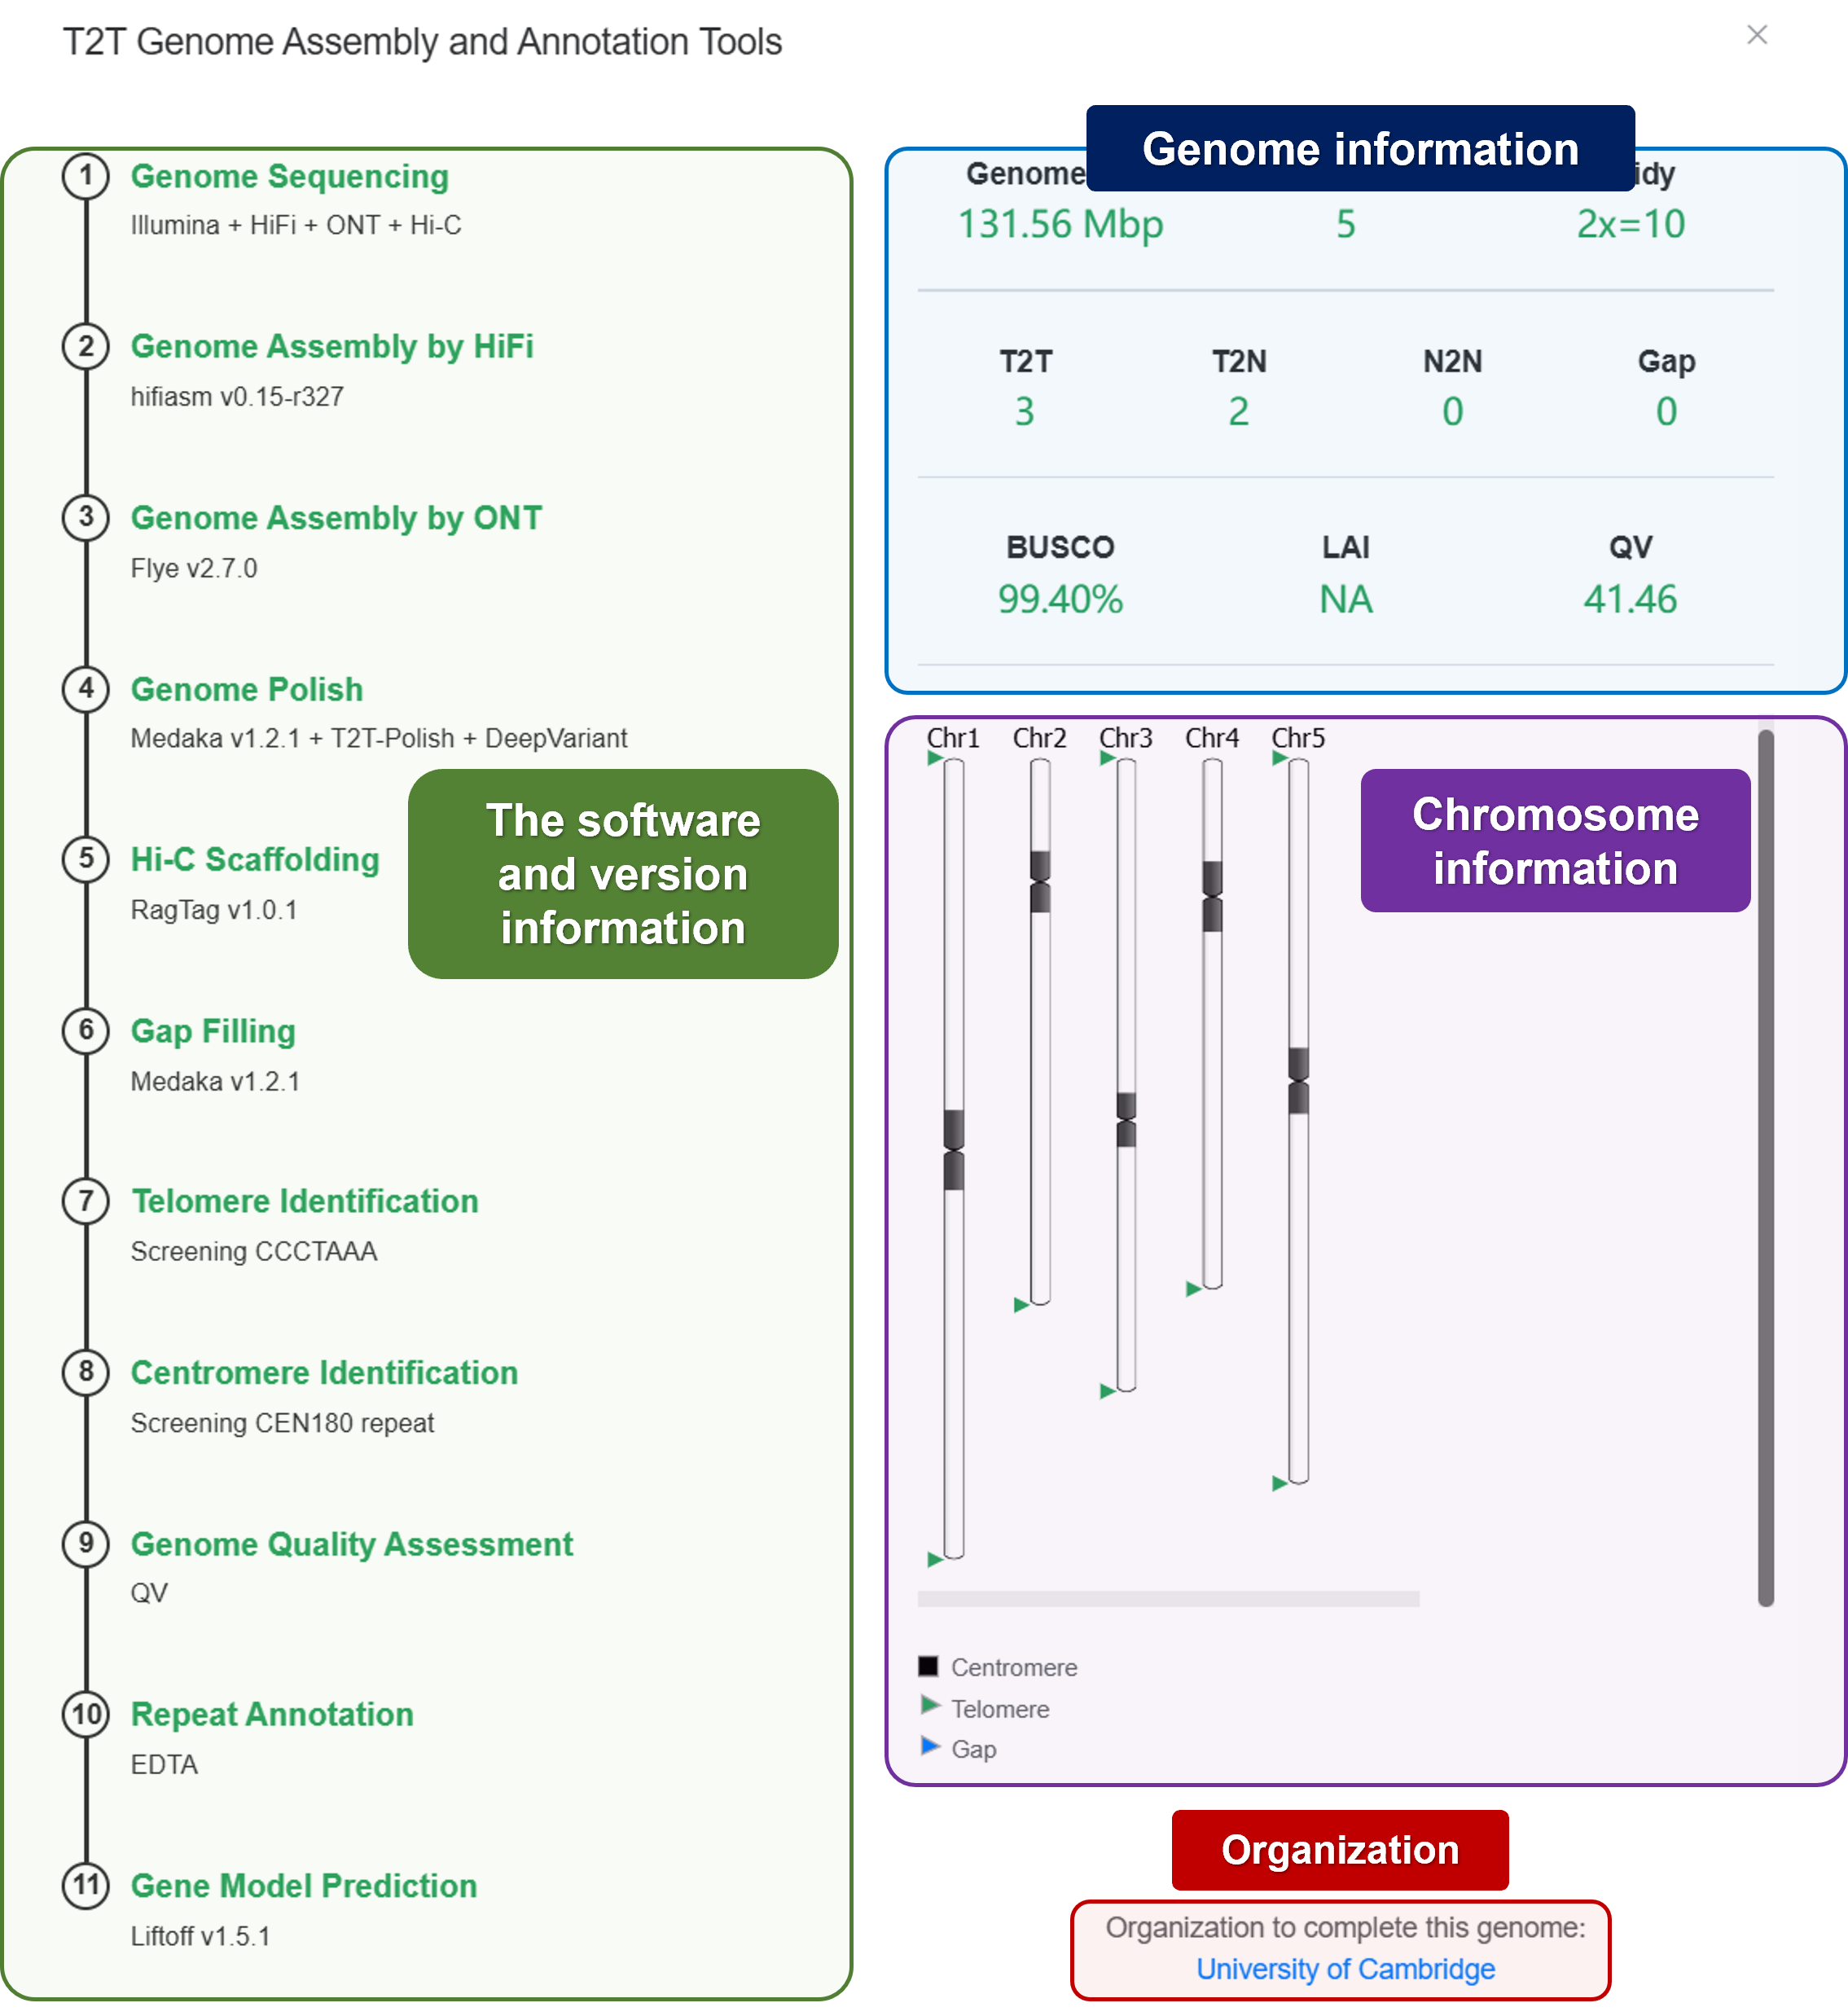
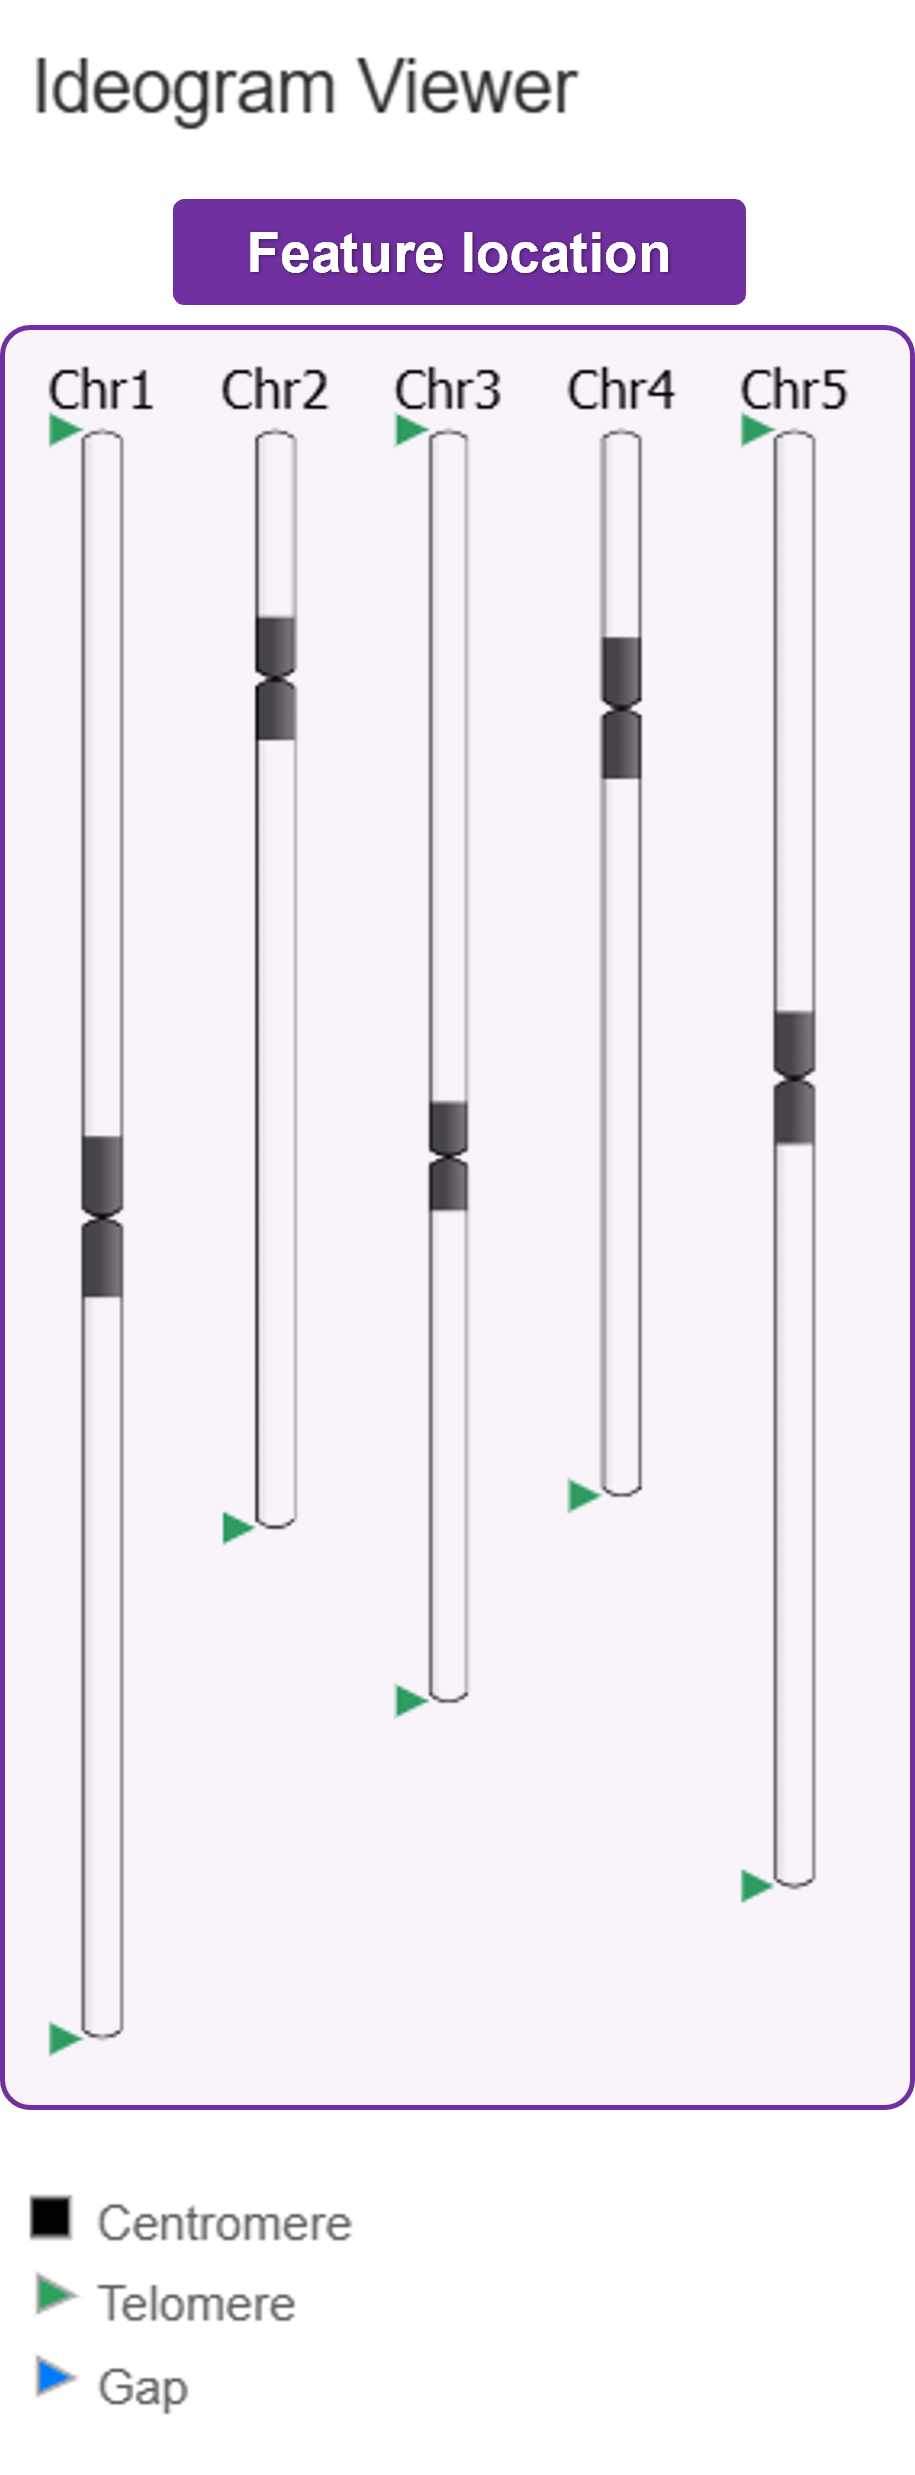
- Ideogram: Visualize the features location (Telomere, Centromere, and Gap).
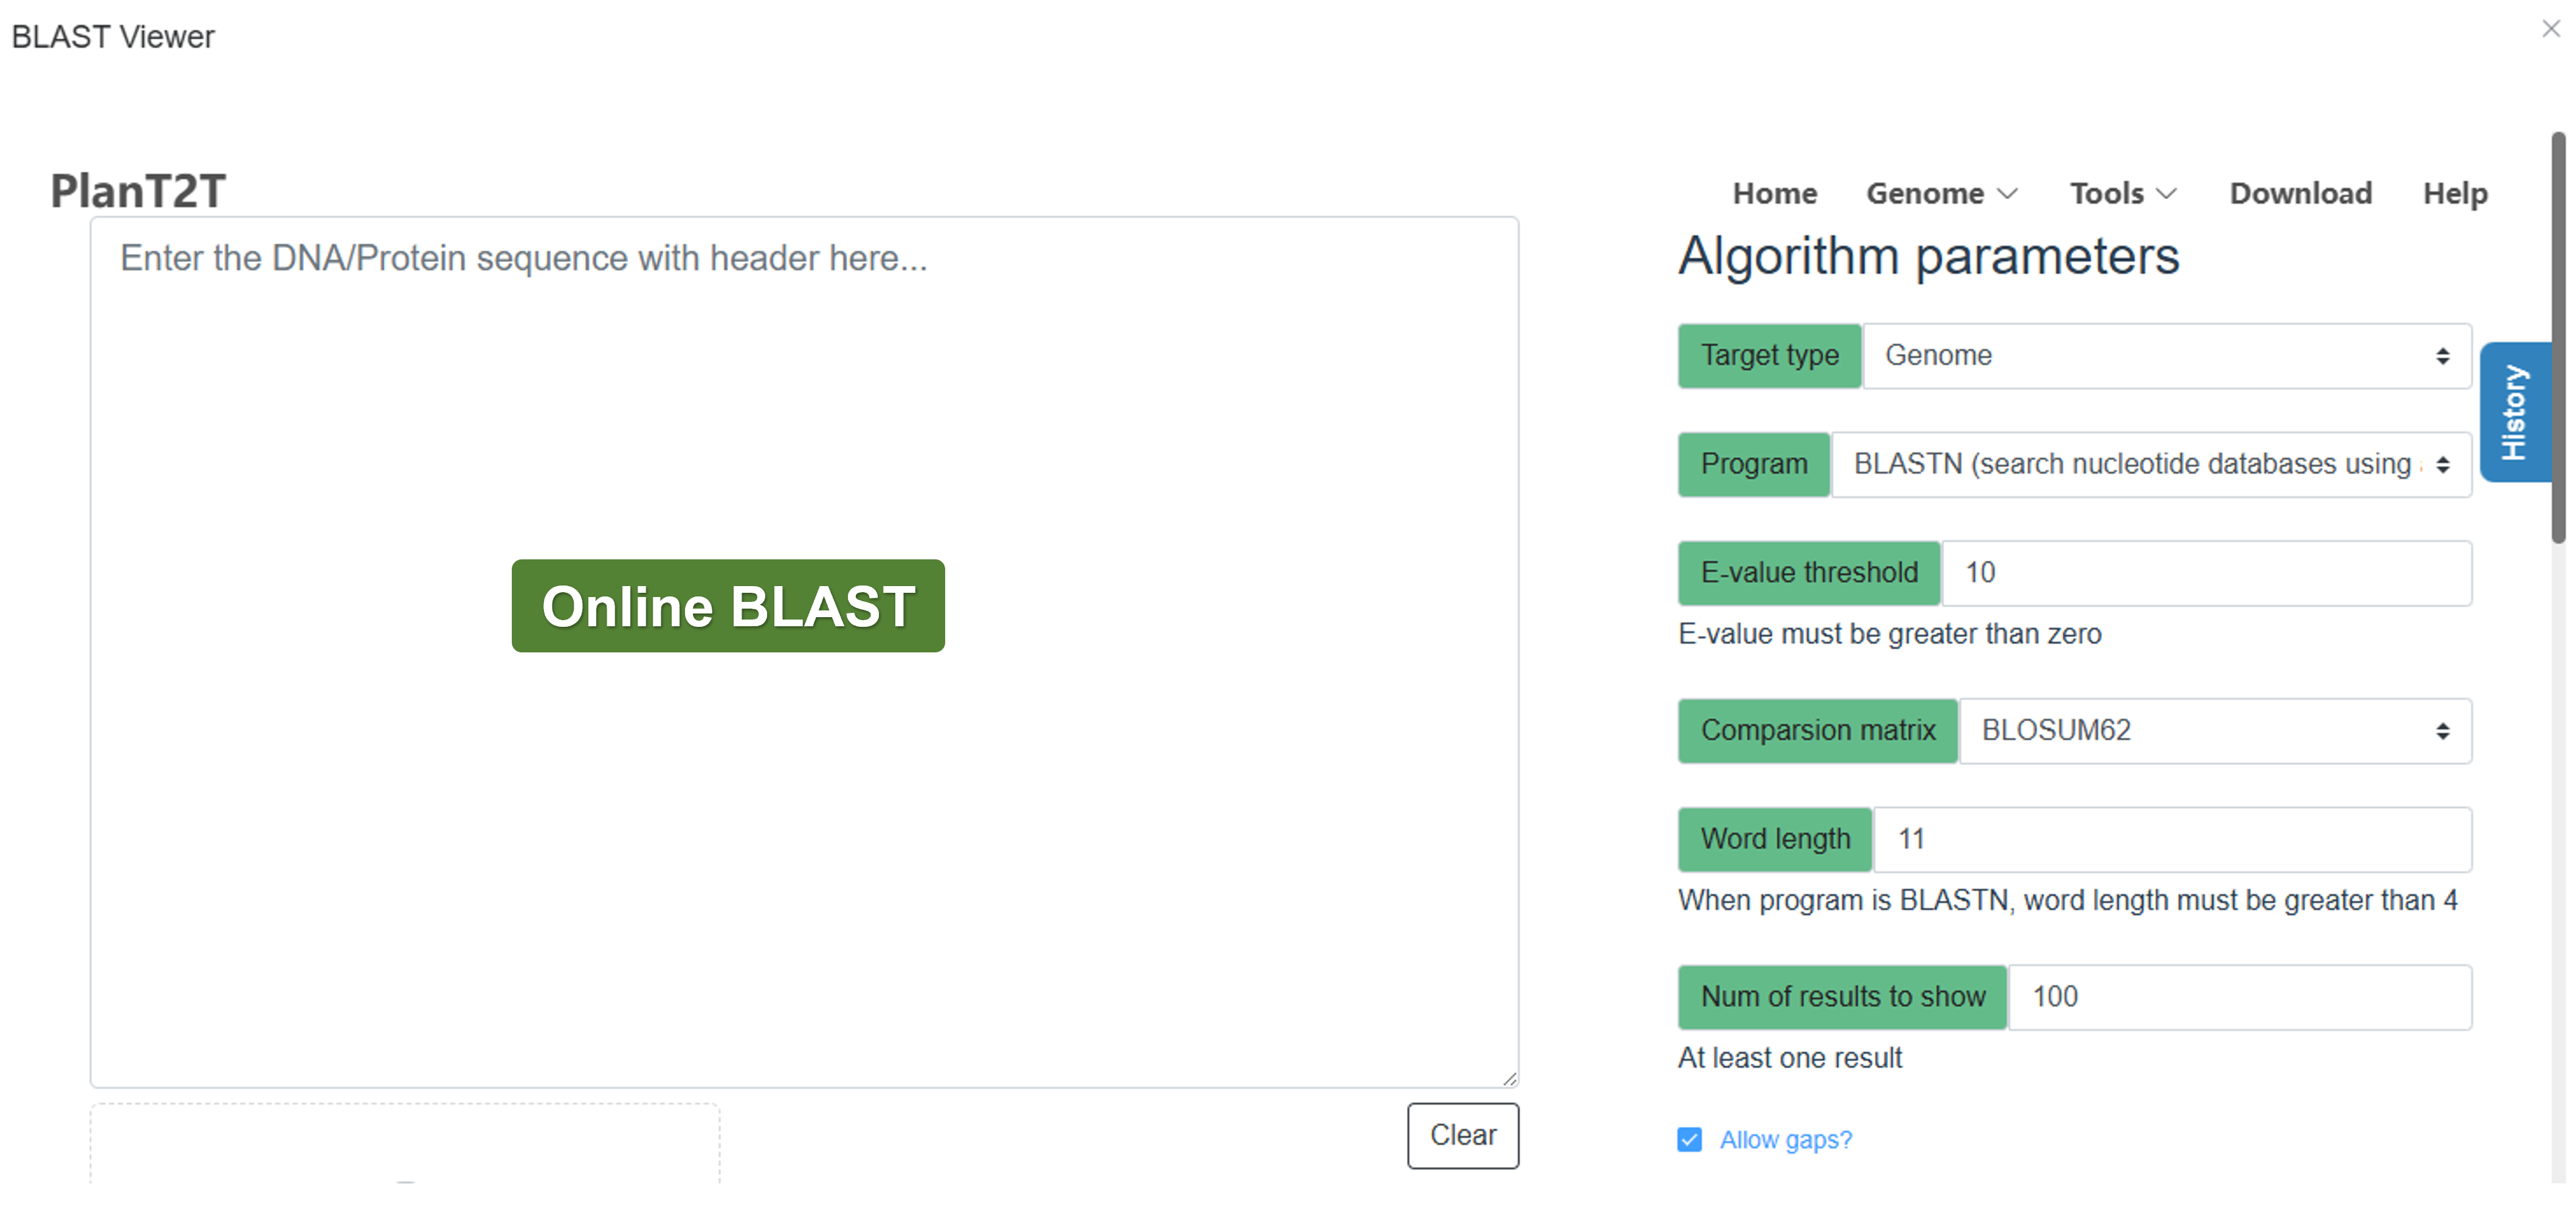
- Blast: Perform sequence alignment and identify similarities with other genomic sequences.
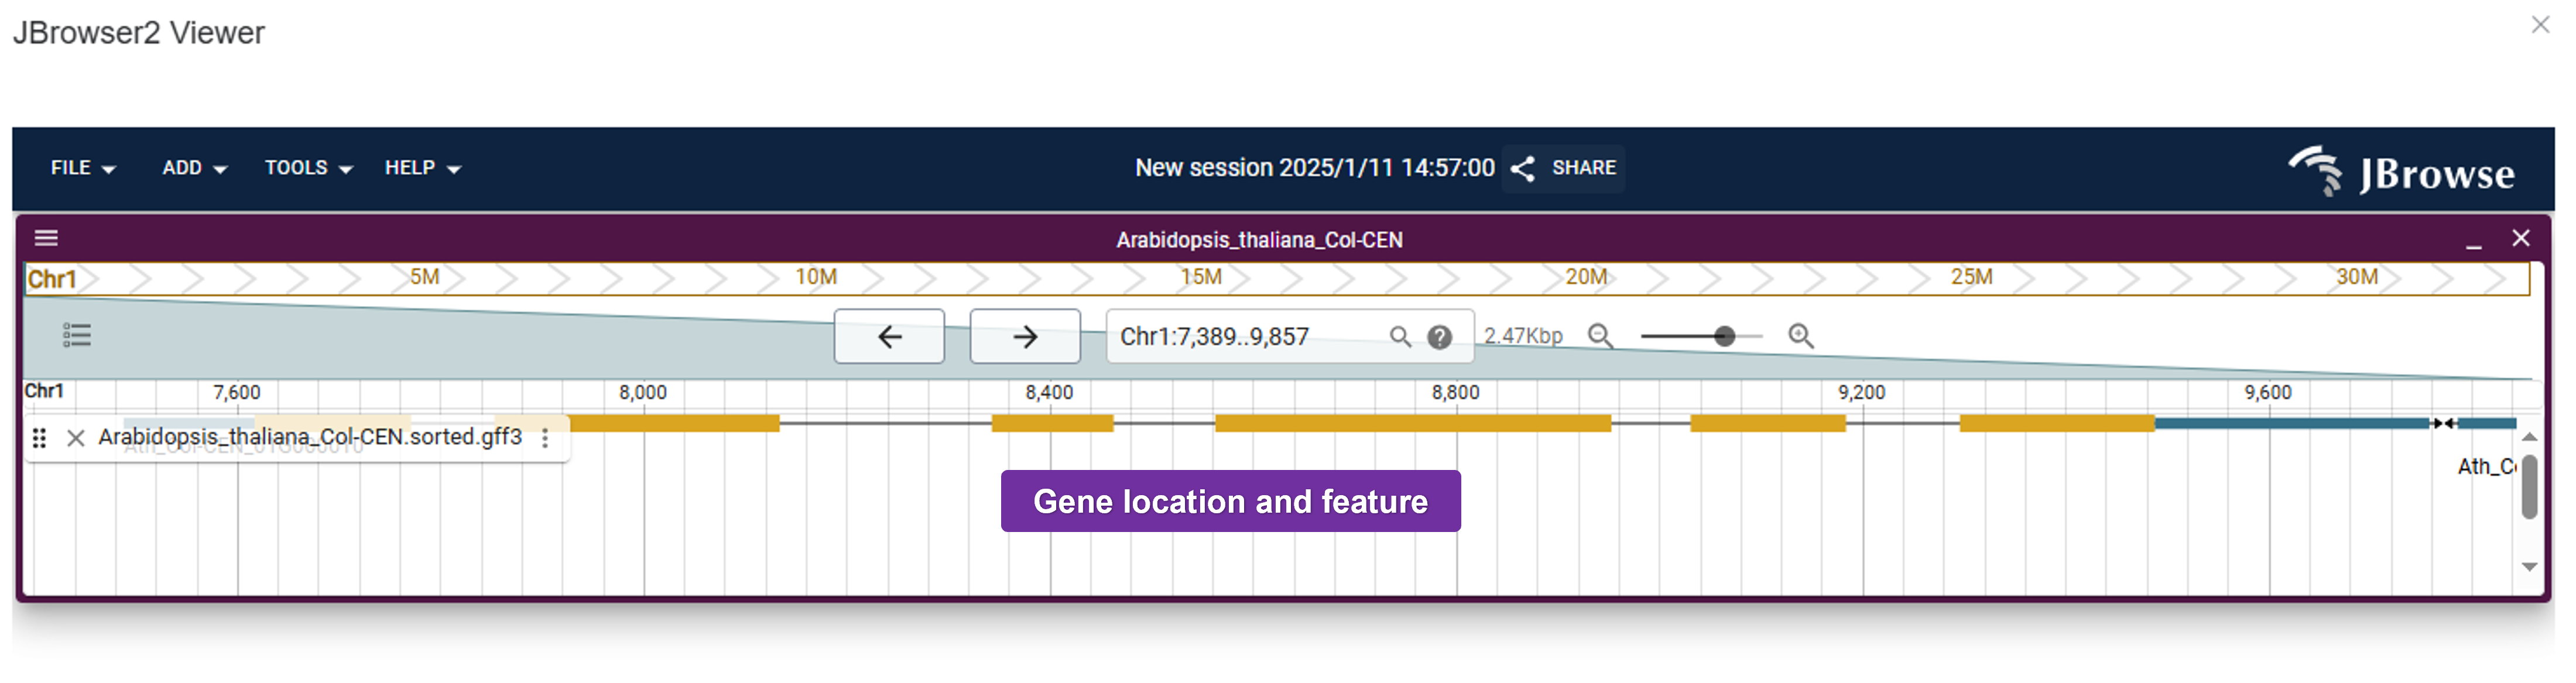
- JBrowser2: Visualize genomic data and explore the genome structure and features.
- OrgDB: Download annotation data for offline analysis or further study.
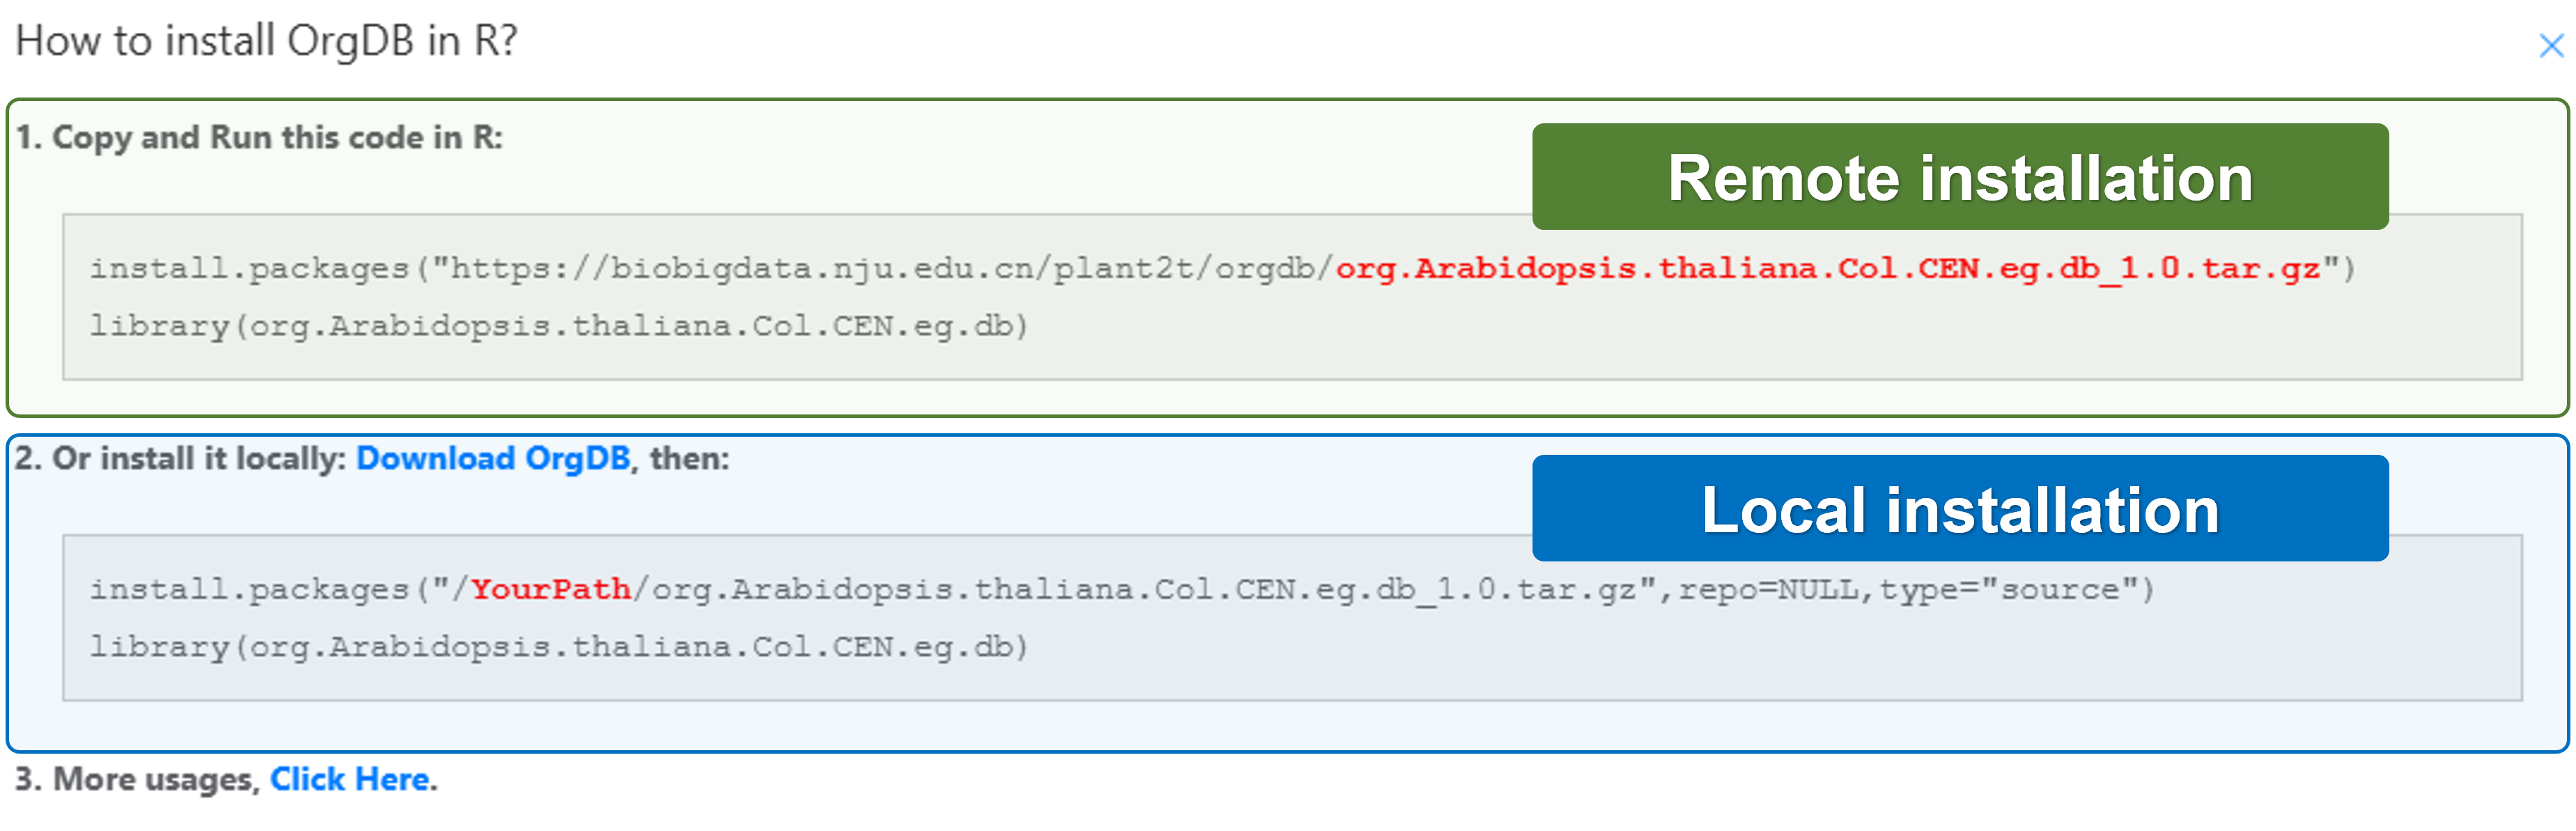
OrgDB usage
Here, we will show you how to use OrgDB.
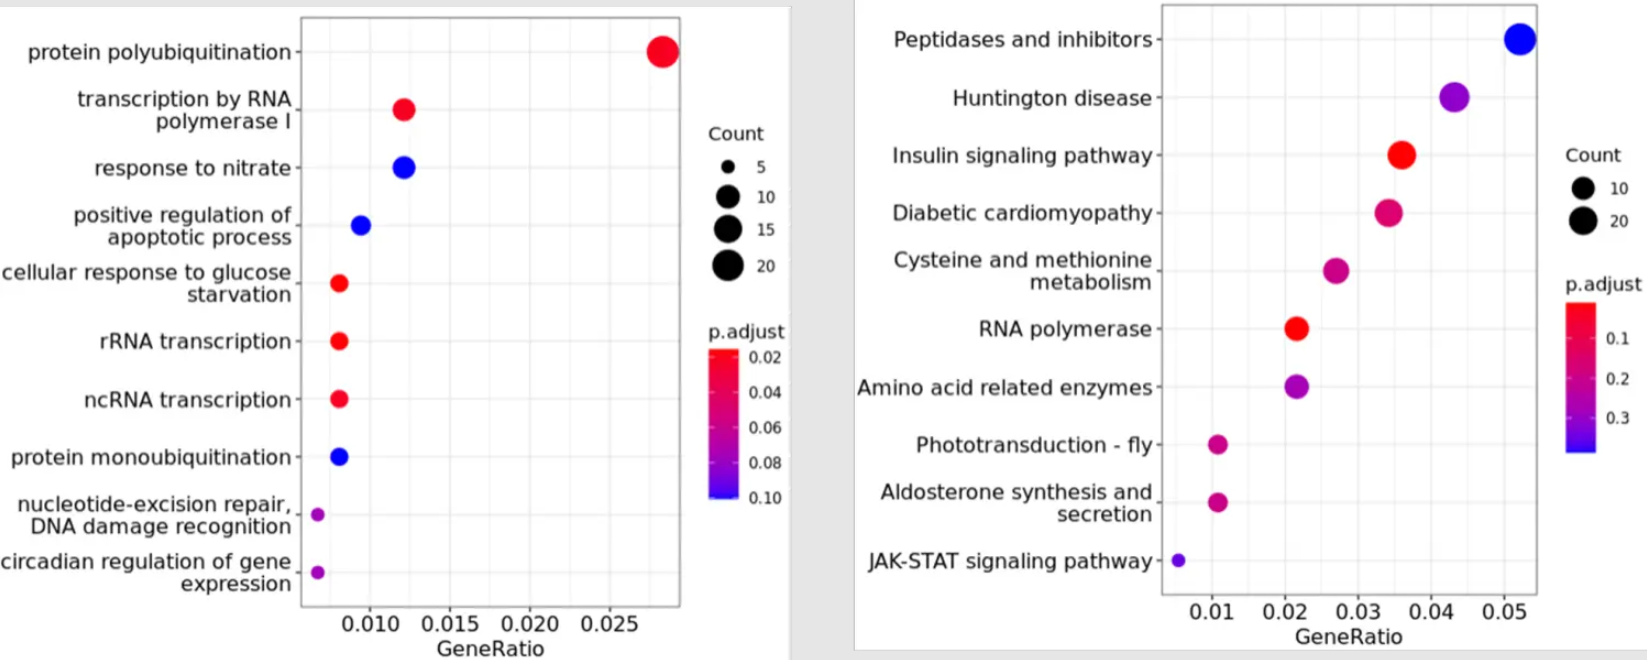
- GO enrichment analysis
install.packages("https://biobigdata.nju.edu.cn/plant2t/orgdb/org.Arabidopsis.thaliana.Col.CEN.eg.db_1.0.tar.gz")
library(org.Arabidopsis.thaliana.Col.CEN.eg.db)
library(clusterProfiler)

gene <- read.csv("Your_diff_gene.csv")
gene_list <- gene[,1]

ego <- enrichGO(gene=gene_list,
                OrgDb=org.Arabidopsis.thaliana.Col.CEN.eg.db,
                keyType="GID",
                ont="ALL",   # CC/BP/MF
                qvalueCutoff = 0.05,
                pvalueCutoff = 0.05)
dotplot(ego)- KEGG pathway analysis
library(clusterProfiler)
library(dplyr)

# You only need to import the following two files each time
pathway2gene <- AnnotationDbi::select(org.Arabidopsis.thaliana.Col.CEN.eg.db,
keys = keys(org.Arabidopsis.thaliana.Col.CEN.eg.db),
columns = c("Pathway", "GID"),
keytype = "GID") %>%
filter(!is.na(Pathway) & !is.na(GID)) %>%
distinct(Pathway, GID)

pathway2name <- pathway4plant %>%
filter(!is.na(level3) & level3 != "") %>%
distinct(level3, pathway_id) %>%
rename(Pathway = pathway_id,
Name = level3) %>%
select(Pathway, Name)

# Import the list of differentially identified genes and convert it into a vector
gene <- read.csv("Your_diff_gene.csv")
gene_list <- gene[,1]

# KEGG pathway enrichment
ekp <- enricher(gene_list,
                TERM2GENE = pathway2gene,
                TERM2NAME = pathway2name,
                pvalueCutoff = 1,  # This keeps all, can be set to 0.05 as a threshold
                qvalueCutoff = 1, # This keeps all, can be set to 0.05 as a threshold
                pAdjustMethod = "BH",
                minGSSize = 1)
dotplot(ekp)- Result visualization
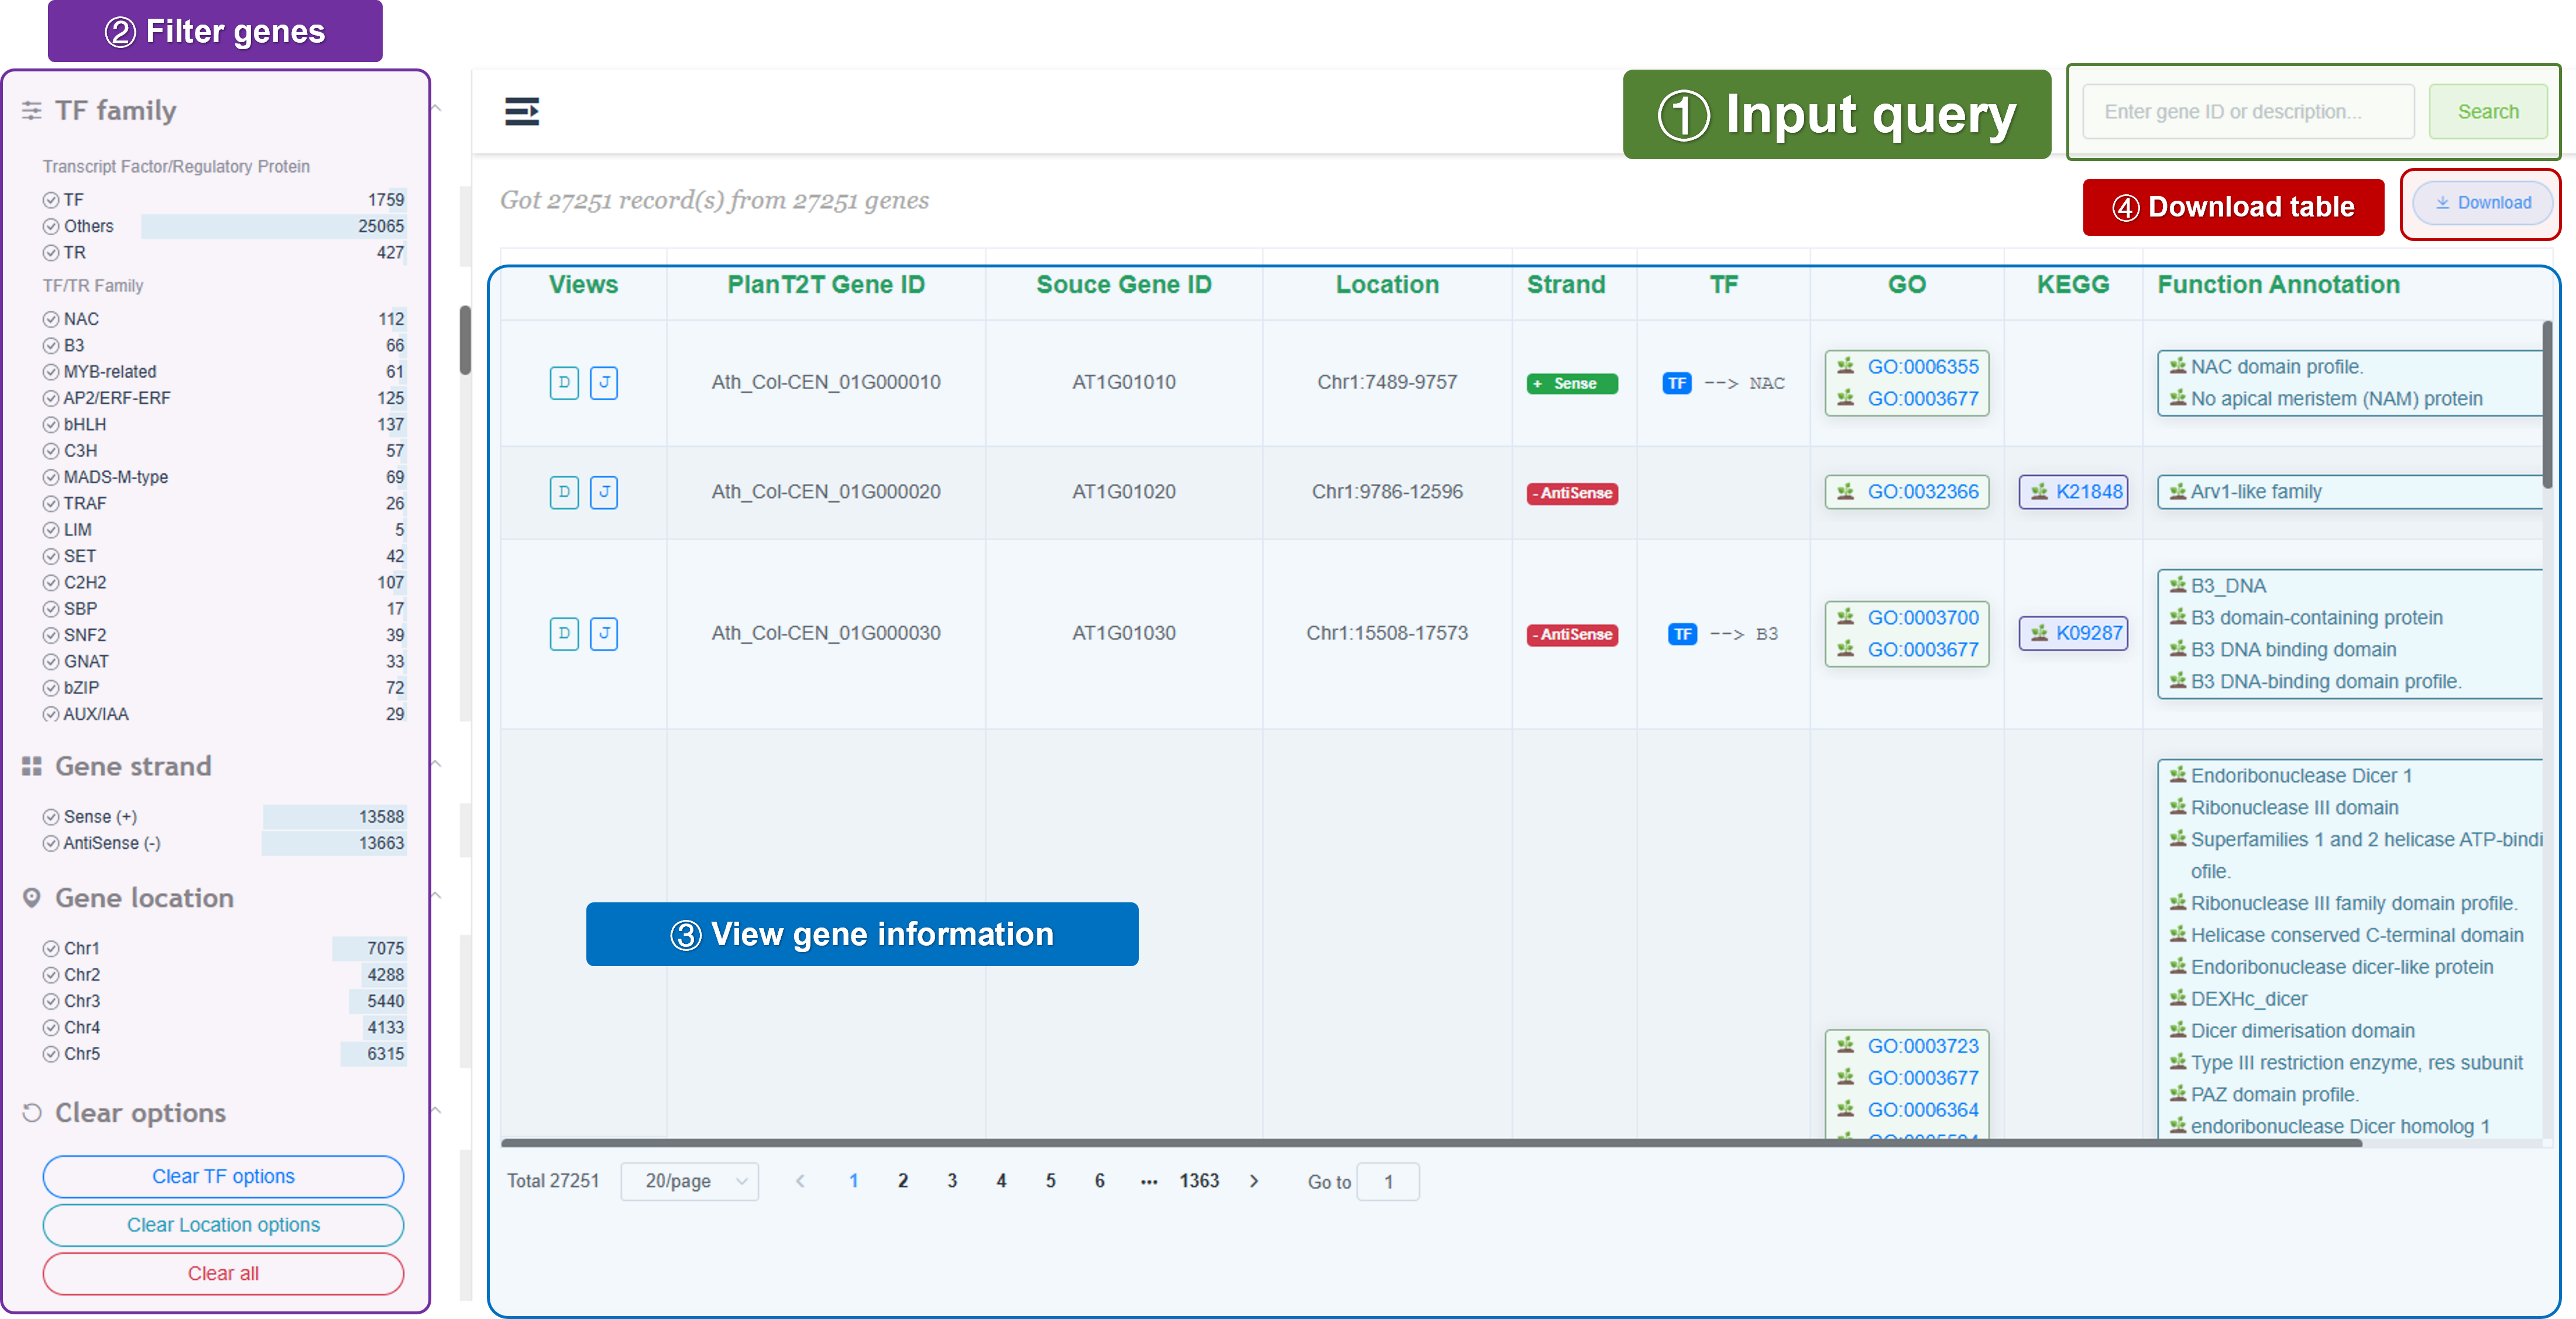
3.2.3 Gene table
PlanT2T provides a gene table for each species. The gene table includes gene ID, gene name, gene description, gene length, and gene location. Users can search, filter, and sort the gene table.
Search: Search for a specific gene by gene ID, gene name, or gene description.
Filter: Filter genes by gene family, gene location, or gene description.
Table: Show gene ID, gene name, gene description, gene length, gene location, gene family, and gene GO annotation.
Download: Download the gene table for offline analysis or further study.