Synteny
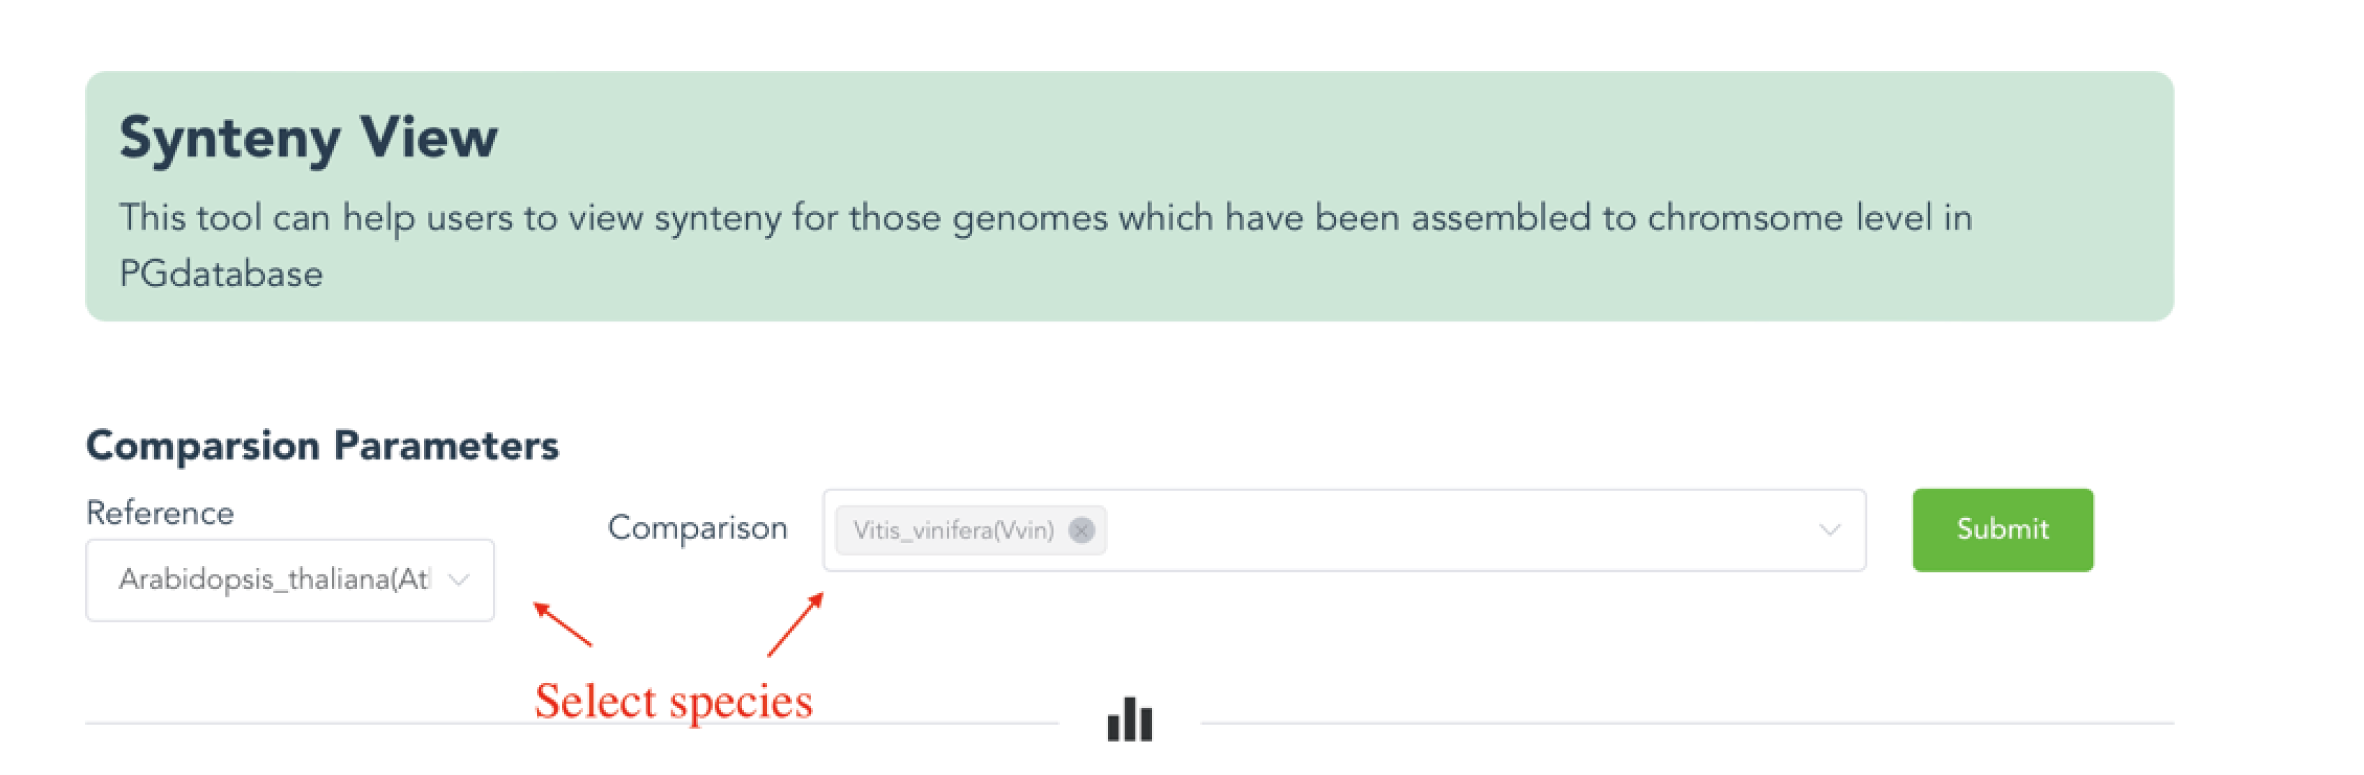
Synteny View
Illustration of how to use Synteny View in PGdatabase
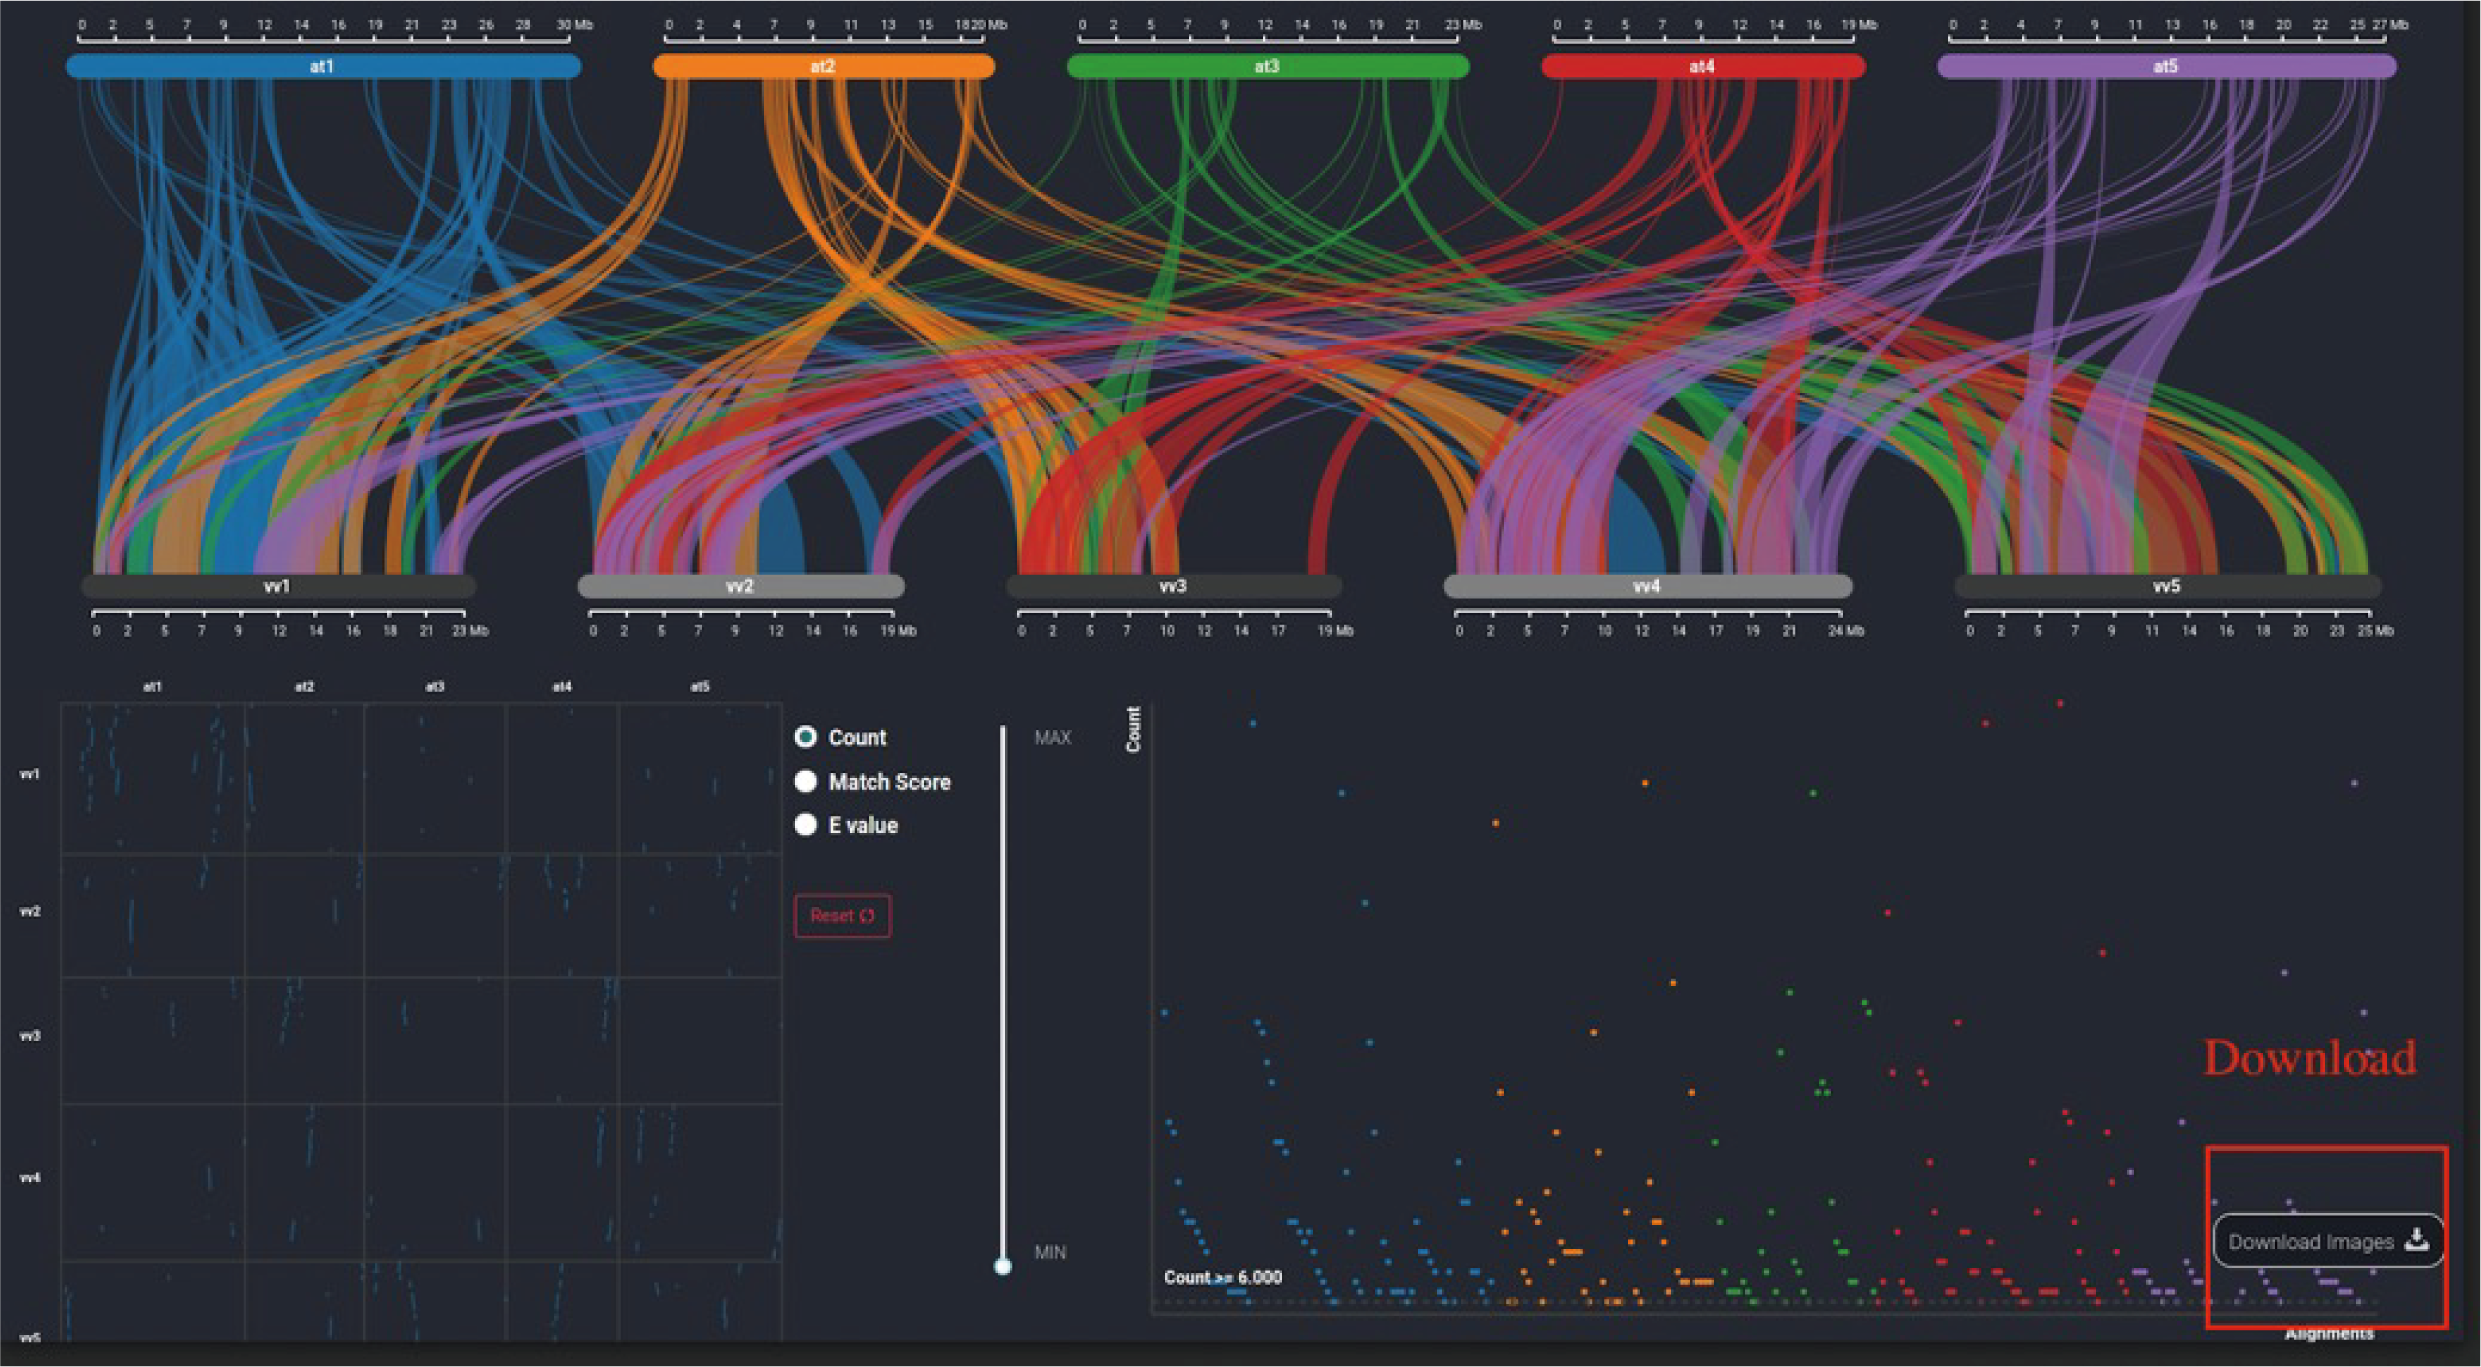
The Synteny View tool offers an intuitive collinear blocks information by embedded MCScanX software. Furthermore, users have multiple options for visualizing collinearity, like Linear Parallel plots, Hive plots, Stacked Parallel Plots and Dot plots. It is easy for users find out some conservative blocks and important functional genes between various species genomes on our database. Here are some personalized choices for visualizing collinearity.
- Collinearity between species. We support users to compare the collinearity between species, such as one vs one or one vs more species (at most five species).
- Visual selection. We support display whole genome collinearity or specific chromosomes depend on users. Optional track file in bedgraph format to annotate the generated charts. Users also can choose to download the generated figures in publication ready SVG or PNG formats.
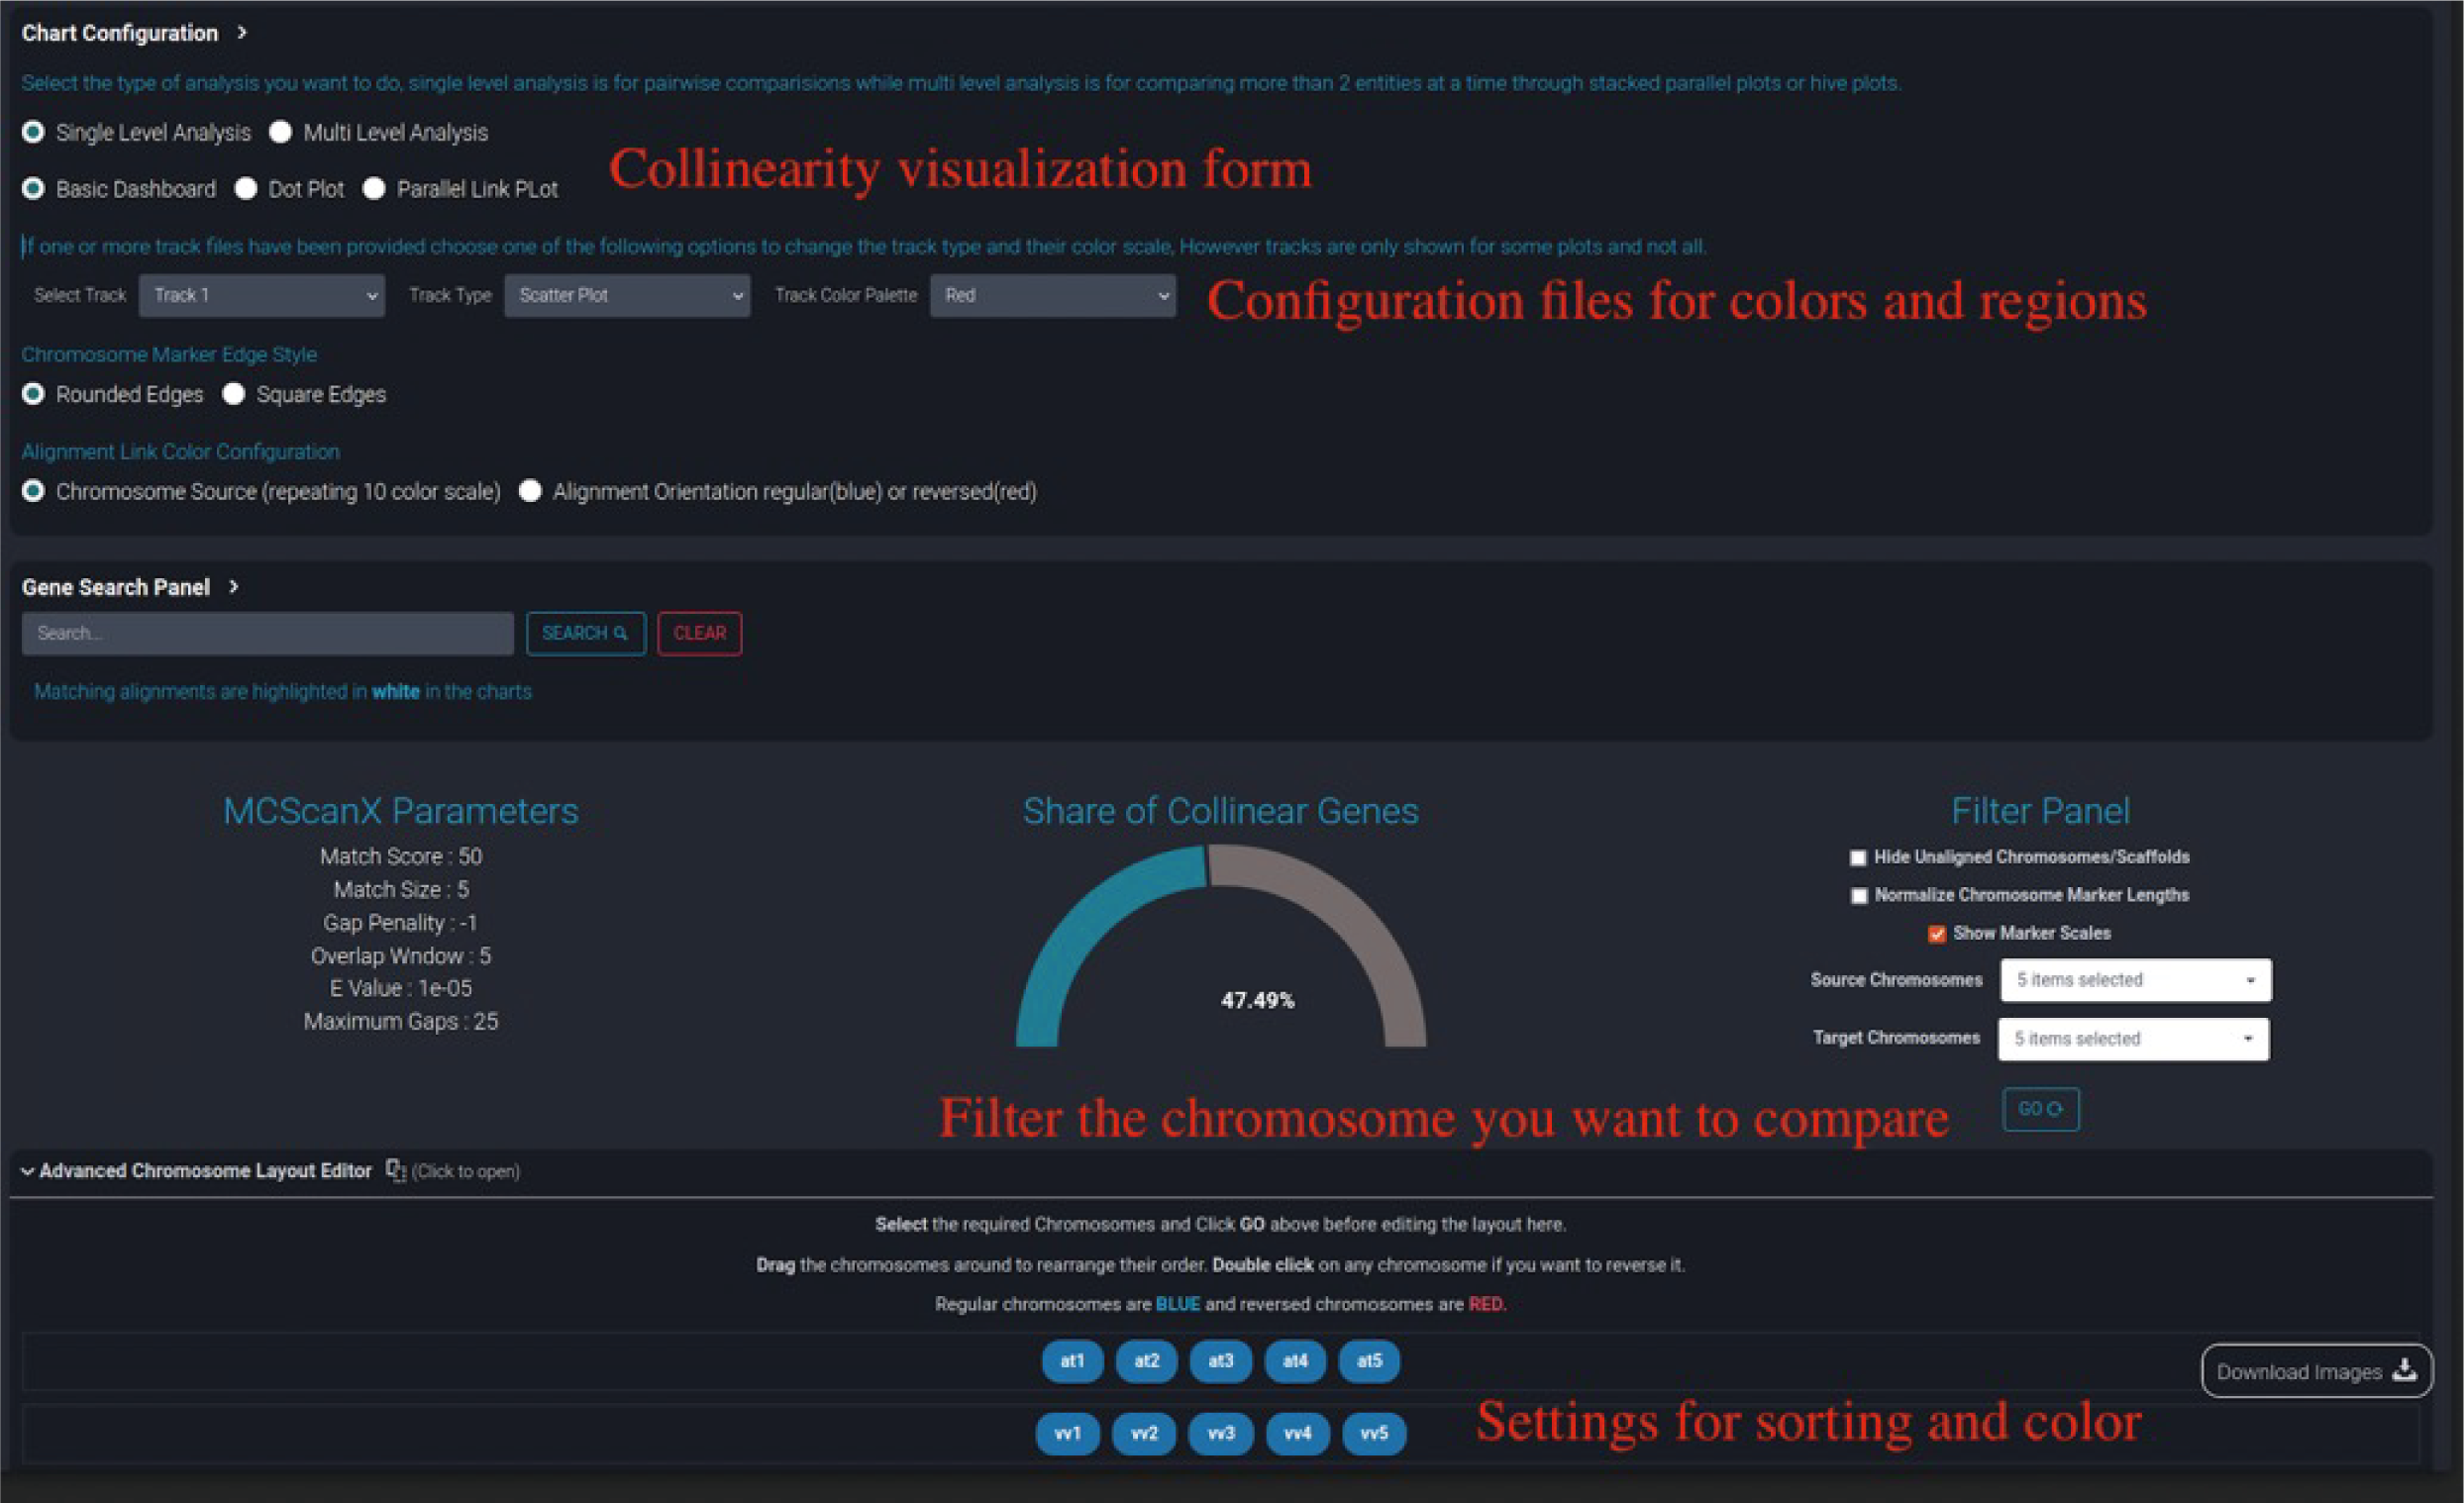
Image display